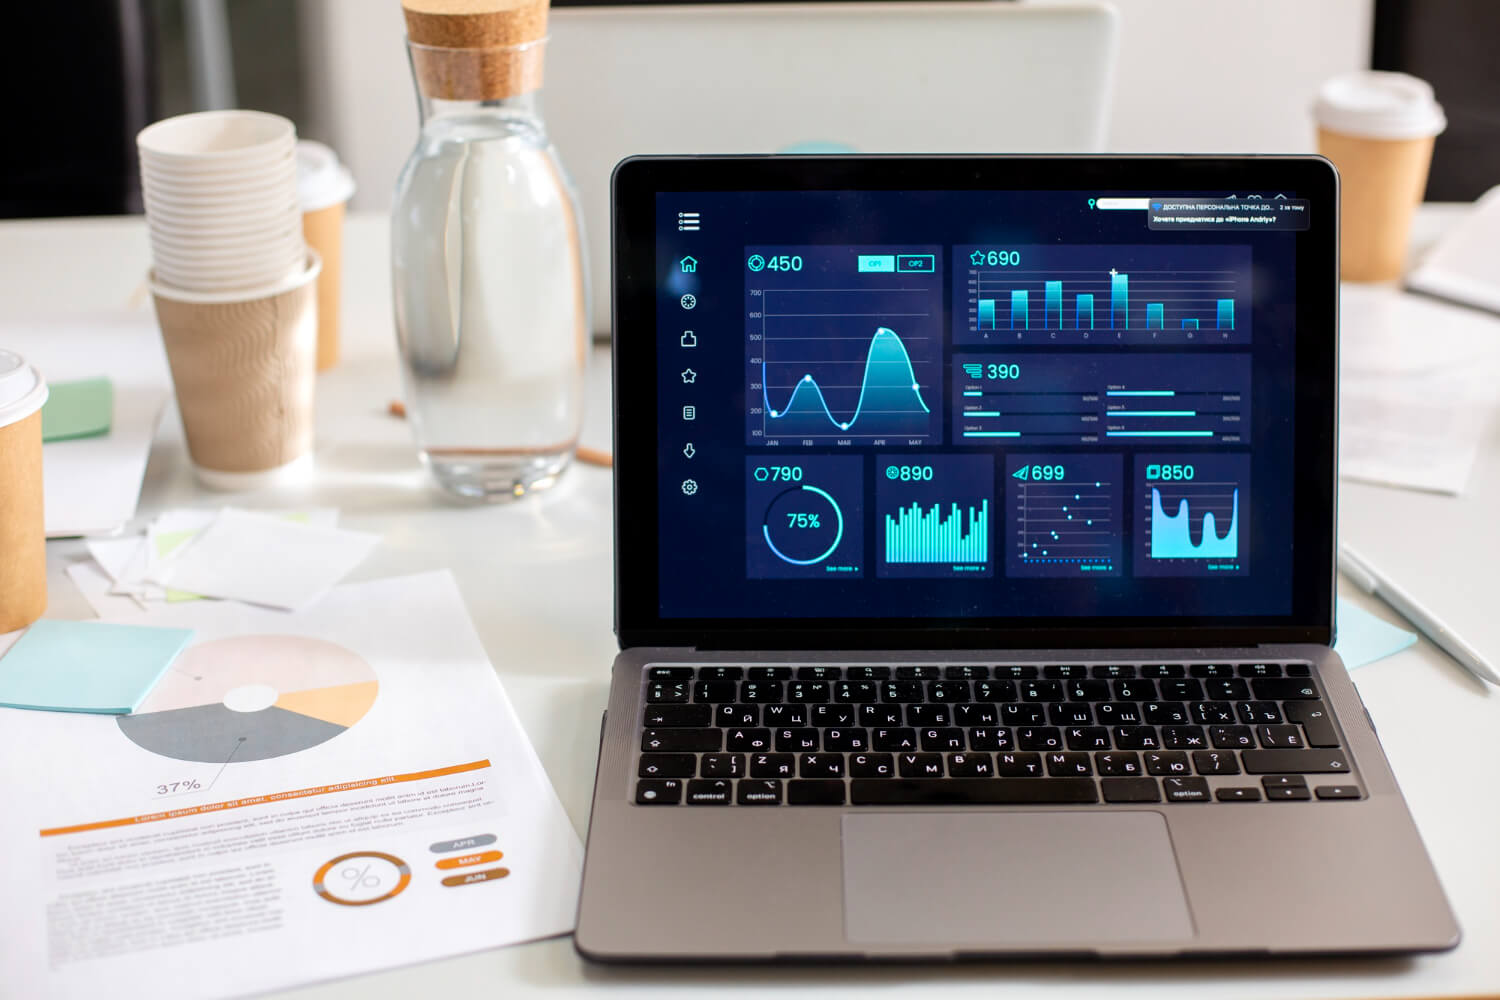
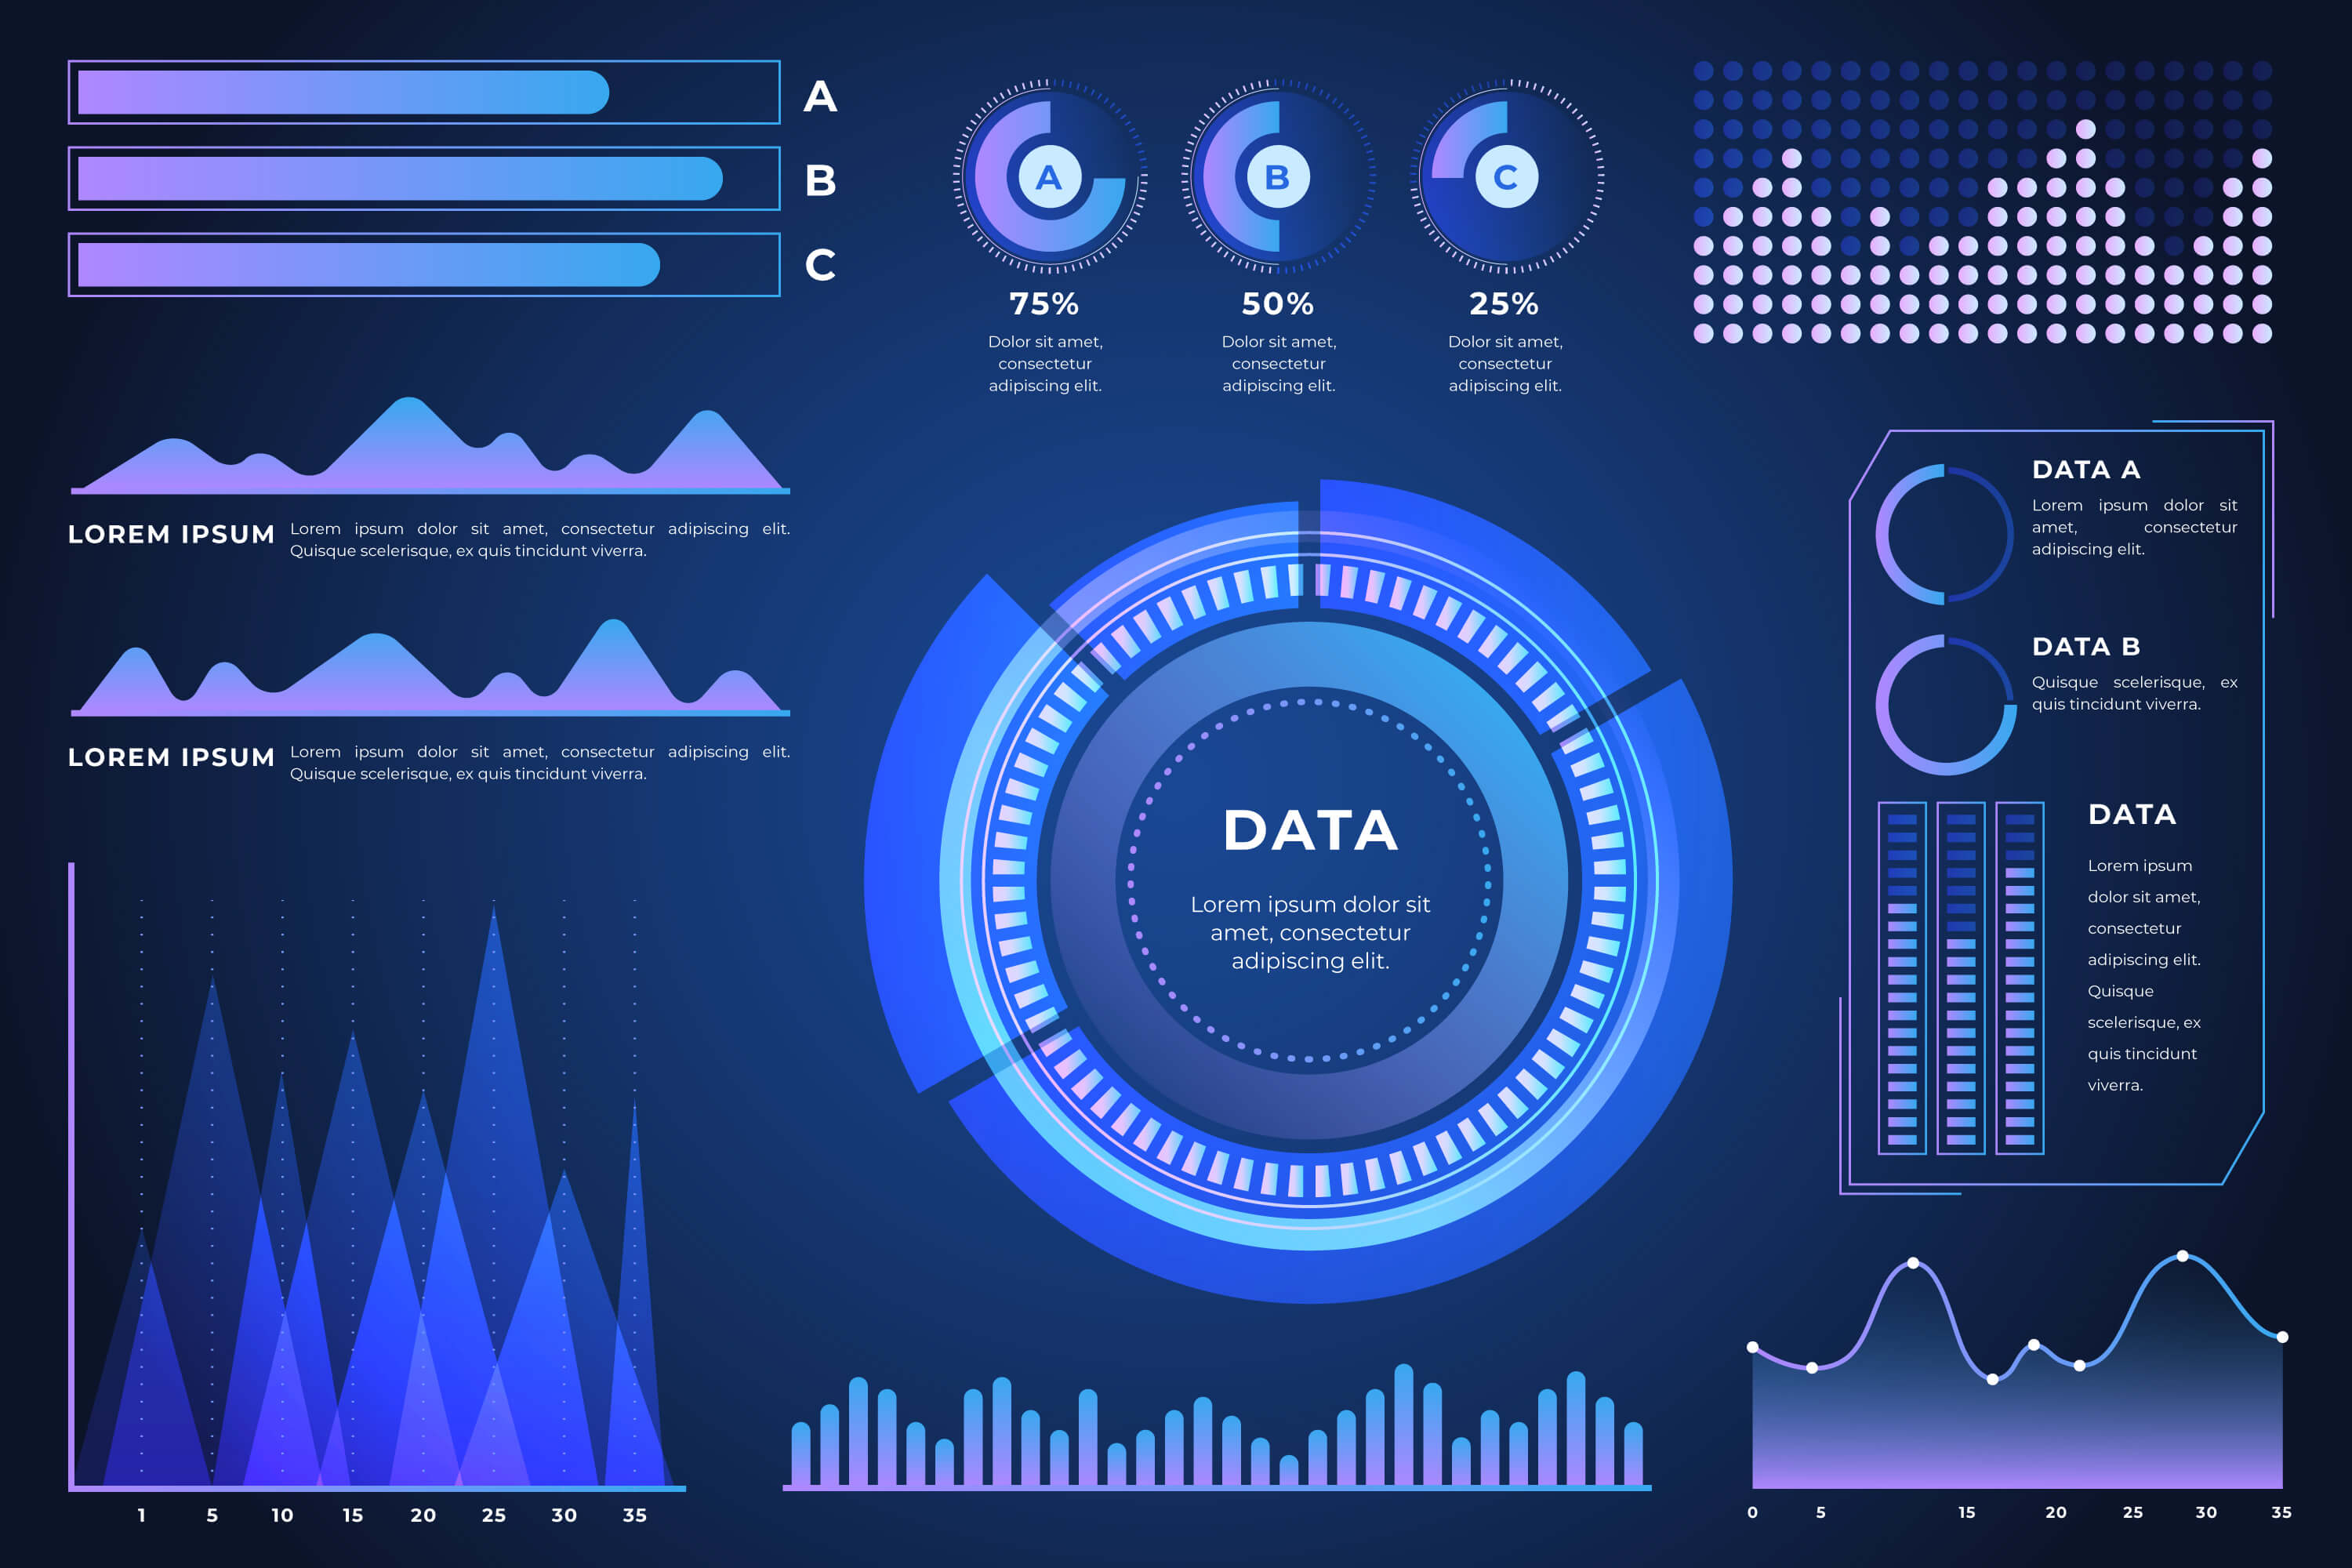
An IT dashboard for business executives should provide clear and concise visualizations of data and information that offer insights into the performance and health of the company’s IT infrastructure and operations.
The dashboard Succurri shares with our Clients can vary depending on what they have hired us to do, but we believe this blog would be a good opportunity to share with everyone what information they SHOULD be getting from their IT service provider.
We customize to the specific needs and goals of our Clients, but below is a summary of the key data and information points that we present for monthly, quarterly, and yearly reviews:
Monthly IT Management Call
Our IT dashboard tools and services include a monthly IT management call. This includes a review of:
1. System Uptime and Downtime: We visualize the percentage of uptime and instances of downtime for critical systems and applications. We also track reasons for downtime and steps taken for resolution.
2. Network Performance: During this time, we display network traffic, bandwidth usage, and latency metrics, identify potential bottlenecks, and optimize network performance.
3. Security Incidents: We present the number and types of security incidents, such as malware, phishing, and unauthorized access attempts. We also show resolution time and any ongoing investigations.
4. Help Desk Metrics: During this meeting, we report on the number of support tickets, average response time, and resolution time. We also monitor and display common issues and trends for proactive support.
5. Patch and Update Status: Our call is an opportunity to show the status of software patches and updates across systems and applications. We also highlight compliance with patch management policies.
6. Vulnerability Scans: We display results of vulnerability scans, including severity levels and remediation status. We also identify areas of concern and track mitigation efforts.
7. Cost and Budget Overview: During this call, we present IT-related costs such as software licenses, hardware maintenance, and operational expenses. We also compare actual costs to budgeted amounts.
8. User Activity: We visualize user activity and engagement with IT systems and applications. We also identify potential areas for training and optimization.
Quarterly IT Pulse Review
Our service includes a Quarterly IT pulse review. This includes:
1. Project Progress and Milestones: Here, we track the progress of major IT projects and initiatives. We present milestones achieved, upcoming tasks, and potential delays.
2. Performance Trends: We analyze trends in system performance, help desk metrics and security incidents. We also compare current performance to previous quarters and set targets for improvement.
3. Compliance and Regulatory Status: We report on compliance with industry standards and regulatory requirements. We also audit results and areas requiring attention and showcase our results to our clients.
4. Data Usage and Storage: During our quarterly IT review, we visualize data usage patterns and storage capacity across systems. We also monitor trends and anticipate future needs.
5. Vendor Performance: We evaluate the performance of IT vendors and service providers. We also monitor service level agreements (SLAs) and identify areas for improvement.
Yearly IT Planning Review
Our IT dashboard tools include a yearly IT planning review. This includes:
1. IT Strategy and Alignment: During this planning review, we assess how IT initiatives align with the overall business strategy and goals. We also identify successes and areas for growth in IT strategy.
2. Technology Roadmap: We present the technology roadmap for the upcoming year, including planned projects and investments. then, we align IT initiatives with business objectives.
3. IT Asset Lifecycle Management: We visualize the lifecycle status of IT assets, including hardware and software. We also identify assets due for retirement or upgrades.
4. Long-Term Cost Trends: We analyze long-term trends in IT spending and budget utilization. We also assess the impact of technology investments on overall business performance.
5. Risk Assessment and Management: This is an opportunity for us to review risk assessment findings and strategies for mitigation. then, we evaluate the effectiveness of risk management initiatives.
6. Employee Training and Development: Our service allows us to track the progress of IT training programs and their impact on performance. From there, we identify skill gaps and opportunities for employee development.
An effective IT dashboard should present this information in a user-friendly and easy-to-understand format, such as charts, graphs, and heatmaps, to facilitate quick insights and decision-making for business executives.
For more information about our services, call Succurri today!